

Run the same person through four popular BMR formulas and you can get answers up to about 230 calories a day apart. That is roughly a small meal, and it is enough to turn a planned weight loss into a plateau or a planned gain into a slow one.
Most calorie advice starts with "find your BMR", as if the number were fixed. It is an estimate, and the formula you pick changes it. To see by how much, we calculated the basal metabolic rate (BMR) for three example adults with four widely used equations. Below are the results, why they differ, and how to decide which number to trust.
BMR is the energy your body uses at rest to keep you alive. Total daily energy expenditure (TDEE) is BMR multiplied by an activity factor. Strictly, these equations predict resting energy expenditure, which is measured under slightly less strict conditions than a true basal rate; calculators use the two terms interchangeably, and so does this article. For the basics of what a calorie is, see what calories are and why they matter.
The four formulas and the three people
We used two kinds of equations. The first kind needs only weight, height, age and sex. The second kind needs your lean body mass (weight minus fat), so it needs a body fat estimate. All of them use metric units: weight in kilograms, height in centimeters.
- Mifflin-St Jeor (1990): men: 10 × kg + 6.25 × cm − 5 × age + 5. Women: the same, with −161 at the end.
- Revised Harris-Benedict (Roza and Shizgal, 1984): men: 88.362 + 13.397 × kg + 4.799 × cm − 5.677 × age. Women: 447.593 + 9.247 × kg + 3.098 × cm − 4.330 × age.
- Katch-McArdle: 370 + 21.6 × lean body mass in kg.
- Cunningham (1980): 500 + 22 × lean body mass in kg.
The three adults are examples we chose to cover different builds, not real clients:
- Man, 30, 80 kg (176 lb), 178 cm (5 ft 10 in), 20% body fat (lean mass 64 kg, or 141 lb).
- Woman, 28, 60 kg (132 lb), 168 cm (5 ft 6 in), 18% body fat, lifts weights (lean mass 49.2 kg, or 108 lb).
- Man, 45, 100 kg (220 lb), 180 cm (5 ft 11 in), 32% body fat (lean mass 68 kg, or 150 lb).
What the numbers show
The formulas disagree by 156 to 233 calories a day for the same person.
| Person | Mifflin-St Jeor | Harris-Benedict (revised) | Katch-McArdle | Cunningham | Gap, highest to lowest |
|---|---|---|---|---|---|
| Man, 30, 80 kg, 20% fat | 1,768 | 1,844 | 1,752 | 1,908 | 156 |
| Woman, 28, 60 kg, 18% fat | 1,349 | 1,402 | 1,433 | 1,582 | 233 |
| Man, 45, 100 kg, 32% fat | 1,905 | 2,036 | 1,839 | 1,996 | 197 |
Multiply by an activity factor to get TDEE. With a commonly used "moderately active" factor of 1.55, the gaps become about 240 to 360 calories a day (for the woman, TDEE ranges from 2,091 to 2,453).
Three patterns stand out:
- Cunningham gave the highest number for both leaner people, and Katch-McArdle gave the lowest number for both men.
- Revised Harris-Benedict came out higher than Mifflin-St Jeor for all three people, by roughly 50 to 130 calories. That fits the original Mifflin-St Jeor paper, which found the 1919 Harris-Benedict equations overestimated measured resting energy expenditure by about 5%.
- The widest spread was for the lean, muscular woman. A likely reason: Mifflin-St Jeor subtracts 161 calories for every woman, while the lean-mass equations ignore sex and use her lean mass directly.
Why they differ, and which one to use
The equations come from different data and different methods. Harris and Benedict published the original equations in 1919, and Roza and Shizgal refit them in 1984 using the same subjects plus later data from Benedict. Cunningham's 1980 equation is a reanalysis of the same Harris-Benedict data, which found estimated lean body mass was the single best predictor. The equation usually called Katch-McArdle is the general fat-free-mass equation Cunningham proposed in a 1991 review of later studies. Mifflin-St Jeor came from new measurements of 498 healthy adults, both normal-weight and obese, published in 1990.
In a 2005 systematic review for the American Dietetic Association, Frankenfield and colleagues compared the most commonly used equations against measured resting metabolic rate. Mifflin-St Jeor predicted within 10 percent of the measured value for more nonobese and obese people than any other equation and had the narrowest error range. That is why it is a sensible default.
A rule of thumb that follows from the table:
- Start with Mifflin-St Jeor if you do not know your body fat.
- Use a lean-mass equation (Katch-McArdle or Cunningham) if you have a decent body fat estimate, especially if you are muscular or very lean. In a 2014 study of 90 recreational athletes, ten Haaf and Weijs found the Cunningham equation predicted measured resting energy expenditure accurately, while Harris-Benedict and Mifflin-St Jeor came within 10 percent for fewer than half of them. Note that Cunningham always runs higher than Katch-McArdle: by 130 calories plus 0.4 calories for every kilogram of lean mass.
- Check your body fat number. A lean-mass equation is only as good as the body fat estimate behind it. If the first man is really at 15% body fat rather than 20%, his lean mass rises by 4 kg and both lean-mass results go up by 86 to 88 calories.
- Treat every result as a starting point. Even Mifflin-St Jeor missed some people's measured rate by more than 10 percent in the 2005 review, and Roza and Shizgal put Harris-Benedict's precision at about plus or minus 14 percent.
How to find your real number
The formula is only the starting point. The reliable method is to test it against your own body:
- Calculate your estimate. A free TDEE calculator can run the Mifflin-St Jeor equation for you and apply an activity level, and its BMR calculator shows the resting figure on its own.
- Eat at that number for two to three weeks and weigh yourself daily.
- Compare the weekly average weight. If it is flat, your estimate is about right. If it is rising or falling, adjust calories by 100 to 150 and test again.
- Recalculate whenever your weight changes by about 5 kg (11 lb), because your needs change with it.
The daily weights are noisy because of water, food in your gut and salt. The weekly average is the number to trust. If your goal is building muscle, set protein alongside calories; see how much protein you need per day by weight and goal.
The takeaway
A BMR formula is a reasonable first guess, not a measurement. Across three example adults and four equations, the same body produced answers up to 233 calories a day apart. Pick a sensible formula, test it on the scale for a few weeks, and let your own results correct it.
This article is general information only and is not medical advice. If you have a medical condition, are pregnant, or are planning a large calorie change, talk to your clinician or a registered dietitian.
Sources
- Mifflin MD, St Jeor ST, Hill LA, et al. A new predictive equation for resting energy expenditure in healthy individuals, American Journal of Clinical Nutrition 1990;51(2):241-7. 498 healthy subjects; simplified sex-specific equations; the 1919 Harris-Benedict equations overestimated measured REE by 5%.
- Roza AM, Shizgal HM. The Harris Benedict equation reevaluated: resting energy requirements and the body cell mass, American Journal of Clinical Nutrition 1984;40(1):168-82. Precision of plus or minus 14%. The revised coefficients are reproduced in Table 1 of this 2016 open-access comparison.
- Cunningham JJ. A reanalysis of the factors influencing basal metabolic rate in normal adults, American Journal of Clinical Nutrition 1980;33(11):2372-4. BMR = 500 + 22 × lean body mass, from the Harris-Benedict data.
- Cunningham JJ. Body composition as a determinant of energy expenditure: a synthetic review and a proposed general prediction equation, American Journal of Clinical Nutrition 1991;54(6):963-9. REE = 370 + 21.6 × fat-free mass, the form usually labeled Katch-McArdle.
- Frankenfield D, Roth-Yousey L, Compher C. Comparison of predictive equations for resting metabolic rate in healthy nonobese and obese adults: a systematic review, Journal of the American Dietetic Association 2005;105(5):775-89.
- ten Haaf T, Weijs PJ. Resting energy expenditure prediction in recreational athletes of 18-35 years: confirmation of Cunningham equation and an improved weight-based alternative, PLoS One 2014;9(9):e108460 (full text).
- Table values: calculated by The Fitness Falcon from the equations above.
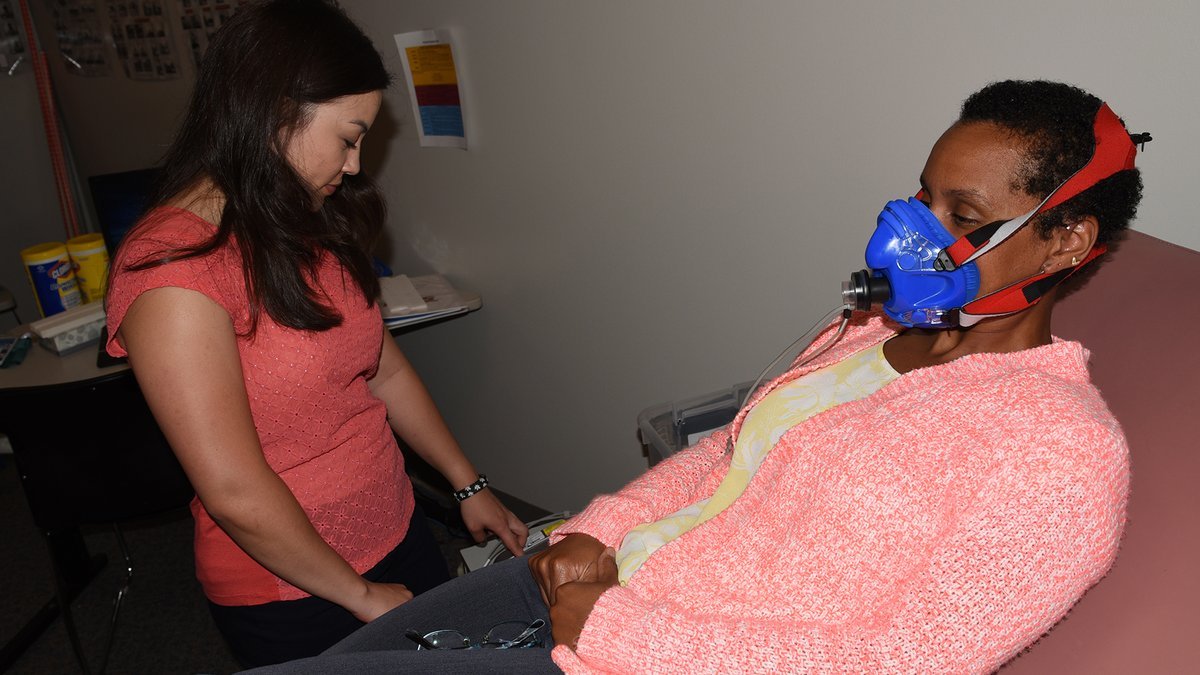
- Banner photo: Building healthy, fit, resilient Airmen (4644924).jpg by Robert Lingley, U.S. Air Force, public domain, via Wikimedia Commons (cropped).
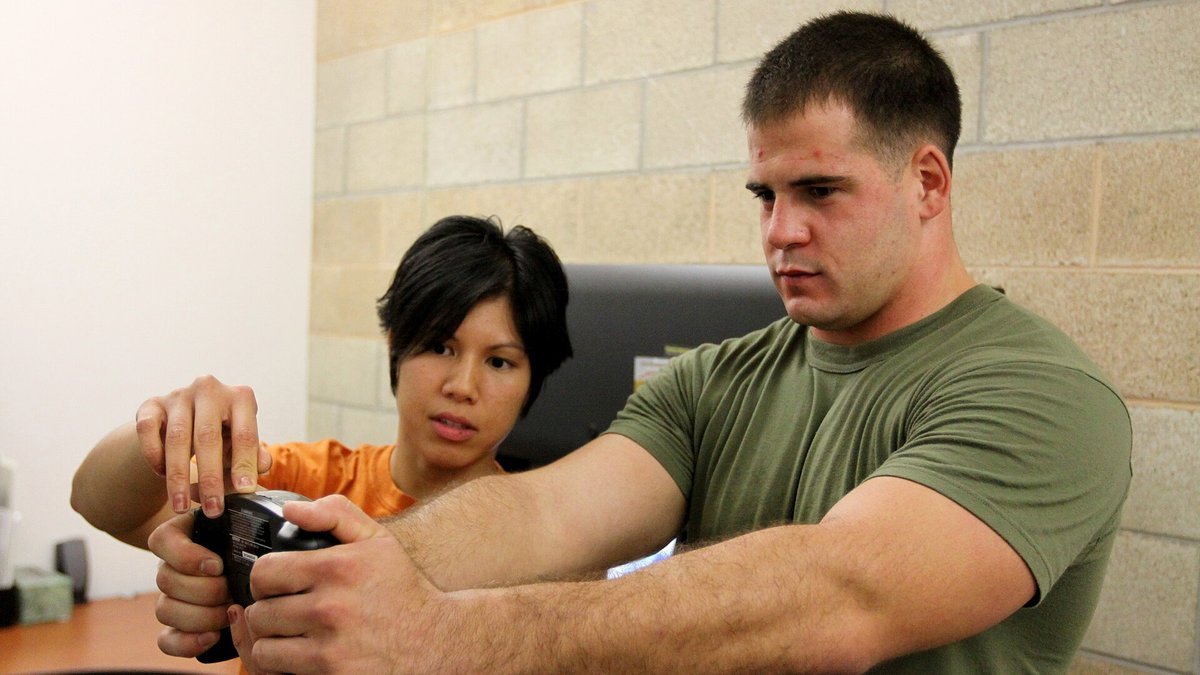
- Photo: USMC-101005-M-3215R-001.jpg, U.S. Marine Corps, public domain, via Wikimedia Commons (cropped).
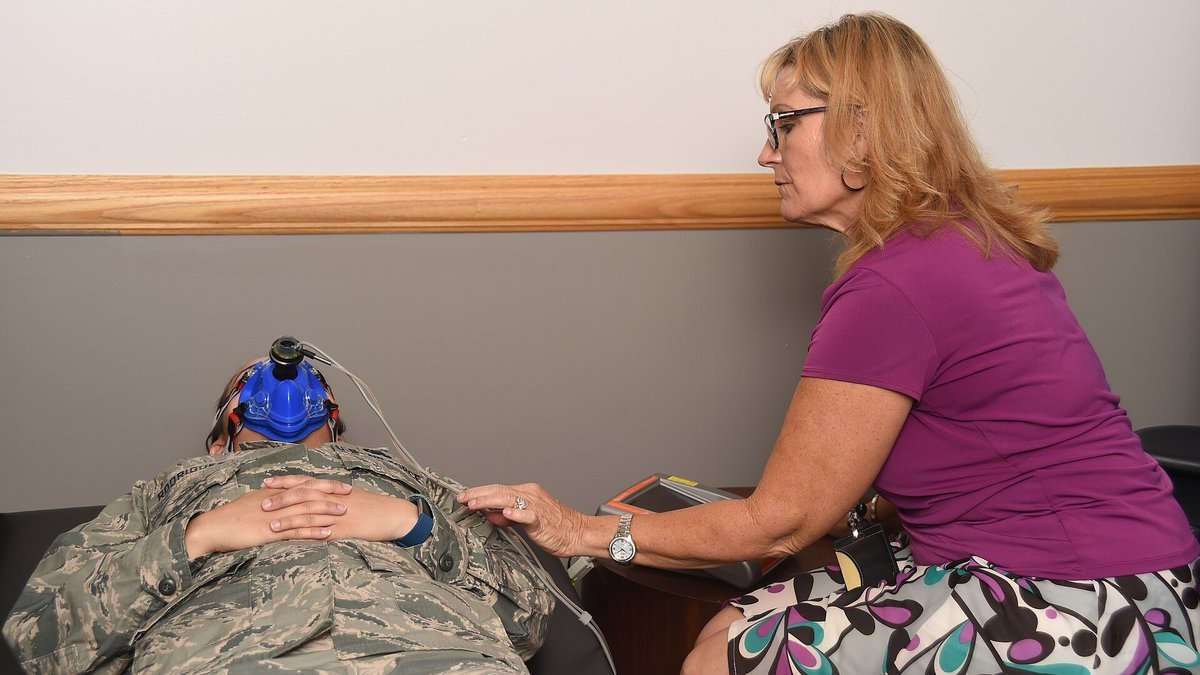
- Photo: HPP keeps Team Schriever fit to fight (3645117).jpg by Senior Airman Arielle Vasquez, U.S. Air Force, public domain, via Wikimedia Commons (cropped).