


FFMI, or fat-free mass index, scores how much lean mass you carry for your height. Because it leaves fat out, it can tell a muscular lifter apart from someone who is simply heavy. BMI cannot.
Take two men who are both 5 ft 11 in and 200 lb. Their BMI is identical, about 28, which falls in the overweight range. One may be a lifter with a lean waist, and the other may not have trained in a decade. The number cannot tell them apart. As the CDC puts it, BMI "does not distinguish between fat, muscle, and bone mass." FFMI was designed to fill that gap.
What FFMI is and how to calculate it
FFMI takes your weight, removes the fat, and scores what is left against your height. That remainder is your fat-free mass: muscle, bone, organs and water. The result answers a question BMI cannot: how muscular are you for your size?
FFMI = fat-free mass (kg) ÷ height (m)²
Fat-free mass is your weight multiplied by (1 − body fat percentage). Take a man who weighs 90 kg (198 lb) at 15% body fat. He carries 76.5 kg of fat-free mass. At 1.80 m (5 ft 11 in), his FFMI is 76.5 ÷ 3.24 = 23.6.
In US units, the same calculation is fat-free mass (lb) × 703 ÷ height (in)². For the same man, that is 168.7 lb × 703 ÷ 71² (5,041) = 23.5, which matches the metric 23.6 except for rounding in the height conversion. Fat-free mass also drives the lean-mass equations for resting calorie burn; see which BMR formula is most accurate.
Normalized FFMI for tall and short people
Taller people tend to score slightly higher even when they are not more muscular. The 1995 study that made FFMI popular adjusted every score to a reference height of 1.80 m (about 5 ft 11 in):
Normalized FFMI = FFMI + 6.1 × (1.8 − height in meters)
Between about 5 ft 9 in and 6 ft 1 in, the adjustment is a third of a point or less. Outside that range it matters more. A 6 ft 4 in lifter (1.93 m) with a raw FFMI of 24 has a normalized score of about 23.2, and a 5 ft 5 in lifter (1.65 m) gains about 0.9 of a point. Use the normalized number when you compare yourself with other people or with the research below.
What a good FFMI score looks like
There is no official FFMI scale. The bands below are a convention widely used by lifting calculators and coaches, not clinical categories from a single study. Two research findings anchor them. In a Swiss study of 5,635 adults, the median FFMI for 18- to 34-year-olds was 18.9 for men and 15.4 for women. And in the steroid study described in the next section, drug-free male athletes topped out at a normalized FFMI of 25.
| Category | Men | Women |
|---|---|---|
| Below average | under 18 | under 15 |
| Average | 18–20 | 15–17 |
| Above average | 20–22 | 17–19 |
| Excellent | 22–23 | 19–21 |
| Superior | 23–26 | 21–23 |
| Exceptional | 26+ | 23+ |
On this scale, the man in the example above (23.6) is in the superior band. A typical young man near the Swiss median of 18.9 is in the average band. The women's bands sit about three points lower because women carry less lean mass for their height. In the Swiss data, the median young woman scored 3.5 points below the median young man. Compare yourself against the bands for your sex, not the other one.
The famous 25: what the research found
The "natural limit" of 25 comes from a 1995 study by Kouri, Pope and colleagues in the Clinical Journal of Sport Medicine. They measured the height, weight and body fat of 157 male athletes: 83 who said they had used anabolic steroids and 74 who said they had not.
- The normalized FFMI of the nonusers reached what the authors called "a well-defined limit of 25.0."
- Many of the steroid users went well past 25, and some exceeded 30.
- As a cross-check, the team estimated the FFMI of 20 Mr. America winners from 1939 to 1959, before steroids were in use. Their mean was 25.4.
Read that limit carefully. The study was small, steroid use was self-reported, and the authors themselves called the findings preliminary. A score near 25 is a strong statistical signal, not proof about any one person. A few people with unusual genetics and many years of training may get close to it. A suspiciously high score far more often has a duller explanation: the body fat estimate is too low.
The input that makes or breaks your score
The FFMI formula is exact. Its weak point is the body fat number you feed it. For the 90 kg man above, a body fat reading 5 points too low adds 4.5 kg of "lean mass" that is not there and raises his FFMI by about 1.4 points. That is enough to jump a band.
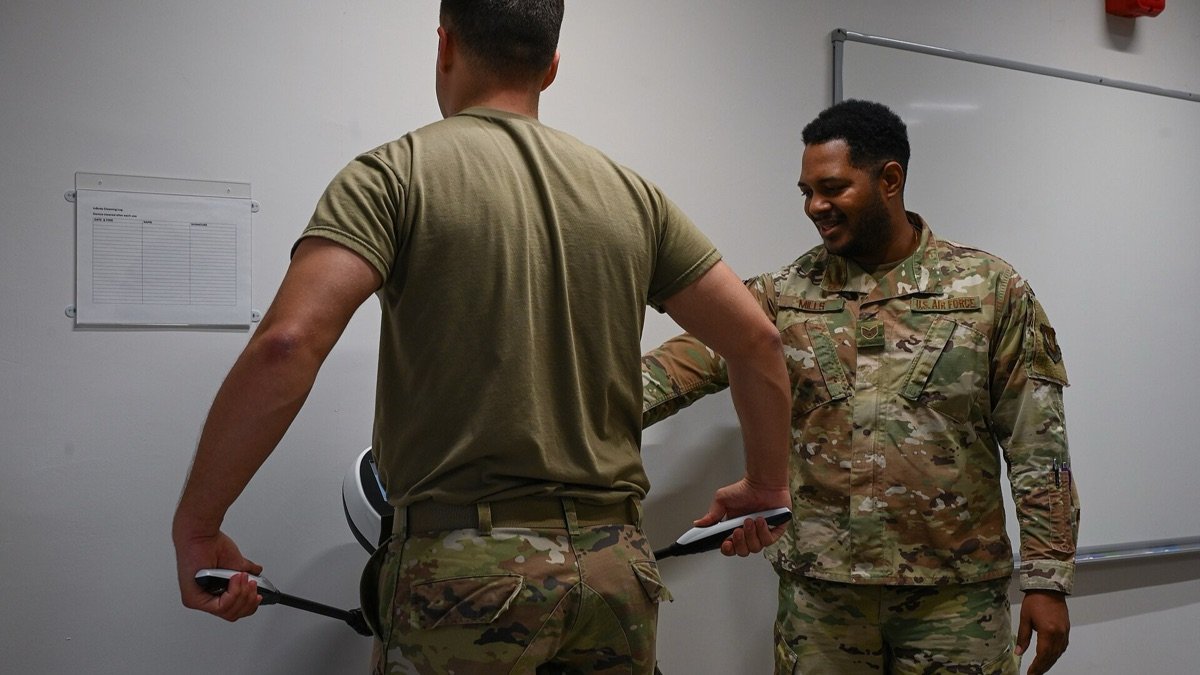
The common ways to estimate body fat, roughly from most to least reliable for home use:
- DXA (dual-energy X-ray absorptiometry) scan. The usual benchmark in research outside a specialist lab, though it is still an estimate. If you rescan, use the same facility.
- Tape (circumference) method. This is the US military approach: neck and waist measurements, plus hips for women, go into a formula. It is free but limited. In a 2022 study of 609 Marines, the tape estimates ran about 2.5 percentage points lower than DXA for men and 1.3 to 2.3 points higher for women, with wide variation between individuals. The authors judged it useful for sorting people into categories but "not valid as a quantitative research tool."
- Skinfold calipers. They are cheap and can be reasonable in skilled hands, but results depend heavily on the person taking them.
- Smart scales and handheld analyzers (bioelectrical impedance). They are convenient. A European clinical guideline notes that they work best in healthy people with a stable fluid balance and are not recommended when hydration is abnormal. Because hydration shifts day to day, use them for trends, not single readings.
Whichever method you pick, the rule that matters most is use the same method every time, under the same conditions. A method with a consistent bias still shows a reliable trend. Mixing a DXA scan one month with a smart scale the next gives you noise that looks like data.
Can you raise your FFMI?
Yes, but only by adding lean mass. Losing fat does not raise FFMI, because the formula removes fat before it scores you. Fat loss simply makes the muscle you already have easier to see.
The math is slow. At 1.80 m, every kilogram (2.2 lb) of lean mass adds about 0.3 of a point, so one full point takes about 3.2 kg (7 lb) of new lean mass. Most lifters gain fastest in their first year or two of training, and progress slows after that. Be wary of any program that promises a jump of several points in a few months; a change that fast is more likely water or a flattering body fat estimate.

The levers are well established:
- Progressive overload. Add weight, reps or sets over time, with most of your work on the big compound lifts.
- Enough protein. A 2018 meta-analysis of 49 trials found that, on average, gains in fat-free mass from resistance training stopped improving beyond about 1.6 g of protein per kg of body weight a day; the upper end of its estimate was 2.2 g/kg. For an 80 kg (176 lb) lifter, 1.6 g/kg is about 128 g a day. See how much protein you need per day by weight and goal.
- Enough total food, sleep and time. Muscle is built over years of consistent training, not weeks.
How to use your FFMI
Calculate your score once. A free FFMI calculator does the math and the height normalization for you. Write the number down, then leave it alone for 8 to 12 weeks. Muscle grows slowly, so a weekly check mostly measures water and your last meal.
Recheck under the same conditions, with the same body fat method, and judge the trend. If the number is climbing, your program is working. If it has been flat for six months, adjust your training or your eating, and use FFMI to check whether the change works.
This article is general information only and is not medical advice. FFMI is a screening number, not a diagnosis; talk to a clinician or registered dietitian about body composition goals linked to a medical condition.
Sources
- Centers for Disease Control and Prevention. About Body Mass Index (BMI). BMI does not distinguish between fat, muscle and bone mass.
- Kouri EM, Pope HG Jr, Katz DL, Oliva P. Fat-free mass index in users and nonusers of anabolic-androgenic steroids, Clinical Journal of Sport Medicine 1995;5(4):223-8. 157 male athletes; the nonusers' normalized FFMI limit was 25.0; 20 pre-steroid-era Mr. America winners averaged an estimated 25.4.
- Schutz Y, Kyle UG, Pichard C. Fat-free mass index and fat mass index percentiles in Caucasians aged 18-98 y, International Journal of Obesity 2002;26(7):953-60. 5,635 adults; median FFMI 18.9 in young men and 15.4 in young women.
- Potter AW, Tharion WJ, Holden LD, et al. Circumference-based predictions of body fat revisited: preliminary results from a US Marine Corps body composition survey, Frontiers in Physiology 2022;13:868627.
- Kyle UG, Bosaeus I, De Lorenzo AD, et al. Bioelectrical impedance analysis, part II: utilization in clinical practice, Clinical Nutrition 2004;23(6):1430-53 (ESPEN guideline).
- Morton RW, Murphy KT, McKellar SR, et al. A systematic review, meta-analysis and meta-regression of the effect of protein supplementation on resistance training-induced gains in muscle mass and strength in healthy adults, British Journal of Sports Medicine 2018;52(6):376-84. Breakpoint 1.62 g/kg/day (95% CI 1.03 to 2.20).
- Worked examples: calculated by The Fitness Falcon from the formulas above.
- Banner photo: Height measurement during a body composition analysis aboard USS Bataan (131002-N-JX484-011) by MCSN Mark Hays, U.S. Navy, public domain, via Wikimedia Commons (cropped).
- Photo: Refueling the Standard: Nutrition's Role in Operational Readiness (9415301) by Staff Sgt. Nicole Molignano, U.S. Air Force, public domain, via Wikimedia Commons (cropped).
- Photo: Two Miles Ahead of the Curve: 86 MXO Airman embraces new fitness standards (9782536) by Airman 1st Class Paden Henry, U.S. Air Force, public domain, via Wikimedia Commons (cropped).